Core Web Vitals measures will start to affect rankings in 2021 as per Google Page Experience Update.
You’ve done everything correctly with your website. You keep the website up-to-date regularly, engage in social media, and have a user-friendly and pleasing interface. So, where are the traffic and conversions going?
The problem likely stems from slow load time. According to Google’s set standards, it only takes a one-second delay for users to leave the site and move on. Luckily, there is also a lot you can do to make your website more user-friendly.
What Is Website Speed And Why Does It Matter?
The time it takes for your site to load in a user’s browser is referred to as site speed or “efficiency.” It has the potential to affect a variety of facets of your website and company in general. It lets people leave your site and go somewhere else to do their work. It affects both bounce rate and conversion rate.

Your slow site will begin to impact your Search Engine Optimization over time (SEO). On both desktop and smartphone searches, Google uses speed as a ranking metric. As a result, if your site takes more than a few seconds to load, your rankings will suffer.
Why is mobile page speed important?
It’s important for businesses to understand that a mobile site’s search engine optimization (SEO) score would not immediately transfer to the desktop site. Instead, Google employs an algorithm that ranks mobile pages based on a combination of desktop and additional parameters. Since sluggish mobile pages have high bounce rates, they lose conversions and provide customers with an unsatisfactory experience, Google revised the algorithm to include page speed.
Customers are not satisfied with websites that neglect mobile SEO in an era where mobile Internet users make up the majority over laptop users. The aim of mobile SEO isn’t to penalize people who make an effort. It’s to get decent results to search engine consumers. Usability relates to the quality and efficacy of a website – two factors that significantly impact the user experience. UX and web page speed work together to offer the best experience to consumers.
The below are some of the most frequent issues that can slow down a mobile site:
- Insufficient file minification
- Images that haven’t been optimised are being included.
- Cheap web hosts for unoptimized browsers, such as apps that use Flash
- Theme designs that are difficult to understand
- Widgets are smaller software programs which can be added to a computer’s desktop.
- Embedded files, such as photos, from other websites
Improving the performance of your website takes no effort and time, and it can have a significant impact on your SEO ranking. Consider if a few hours of free time would be worth it if a few seconds meant thousands of dollars in lost revenue.
What Will The Google Page Experience Update Be?
Google has launched a new ranking algorithm that evaluates web pages based on customers’ experience. It implies that if Google believes your website visitors would have a bad experience on your page, as determined by a new set of metrics known as Core Web Vitals, Google will not rank such pages, as they are already ranking. The update is known as the Google Page Experience update, and it is going to launch in 2021.
According to Google, the revised release timeline was made in part to allow advertisers more time to make adjustments that would benefit Page Experience. Although the updated timeline allows us to all breathe a little better, we recommend that you start preparing for the launch as early as possible, especially if you need Google to re-crawl the pages.
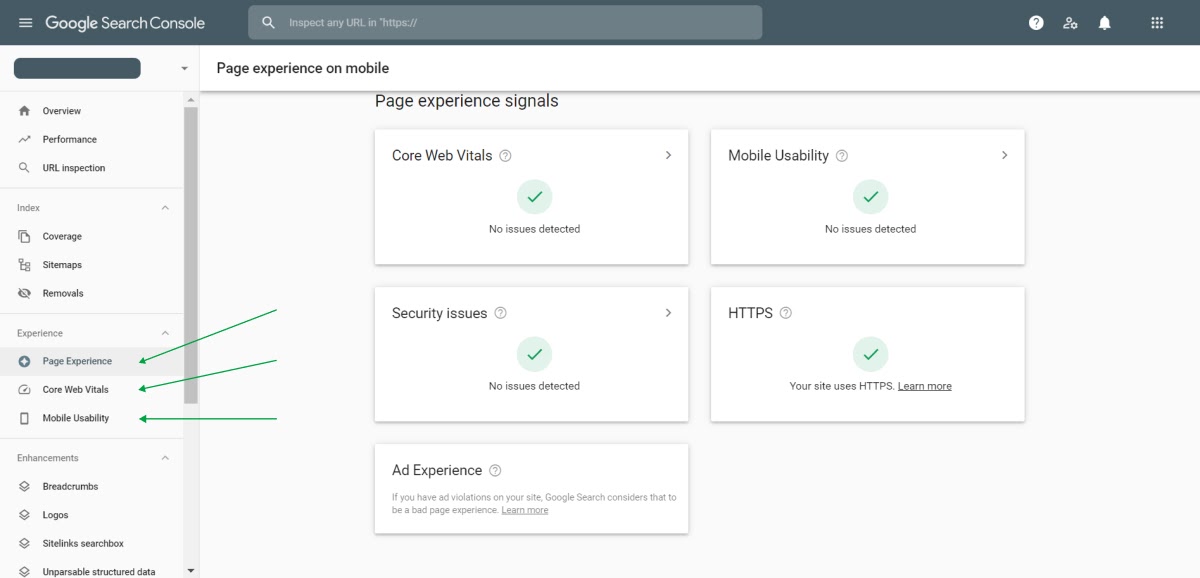
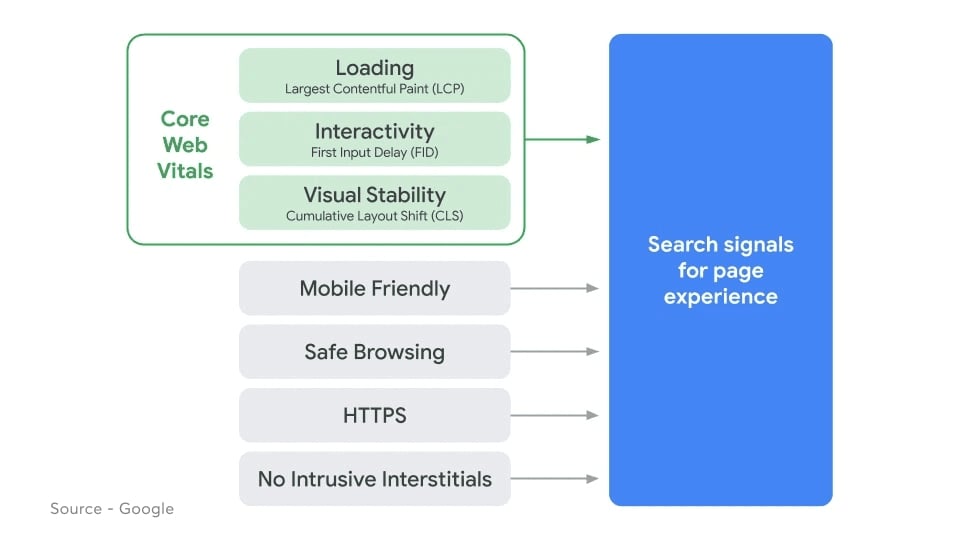
As discussed, the Page Experience updates will take into account many facets of site success that are still ranking considerations but will now be grouped together under this updated, rebranded umbrella — mobile friendliness, secure surfing, HTTPS, and avoiding intrusive interstitials.
The most significant difference is that it will now contain the three Core Web Vitals measurements:
- Largest Contentful Paint (LCP)
- First Input Delay (FID)
- Cumulative Layout Shift (CLS)
The Page Experience update will take into account Google Chrome’s latest CLS measurements.
Aside from Core Web Vitals and their relevance for pagespeed, this change removes the need for AMP formatting for posts to appear in previously AMP-only / Top Story carousels.
This means that not only can a better Page Experience help you increase your overall search performance, but passing scores will also allow you to appear in places that were previously off-limits.
What Are The Core Web Vitals?
User-centered, real-world metrics are included in Core Web Vitals, and they have rankings on aspects of the websites such as load time, interactivity, and content quality as it loads. These metrics cover such categories:
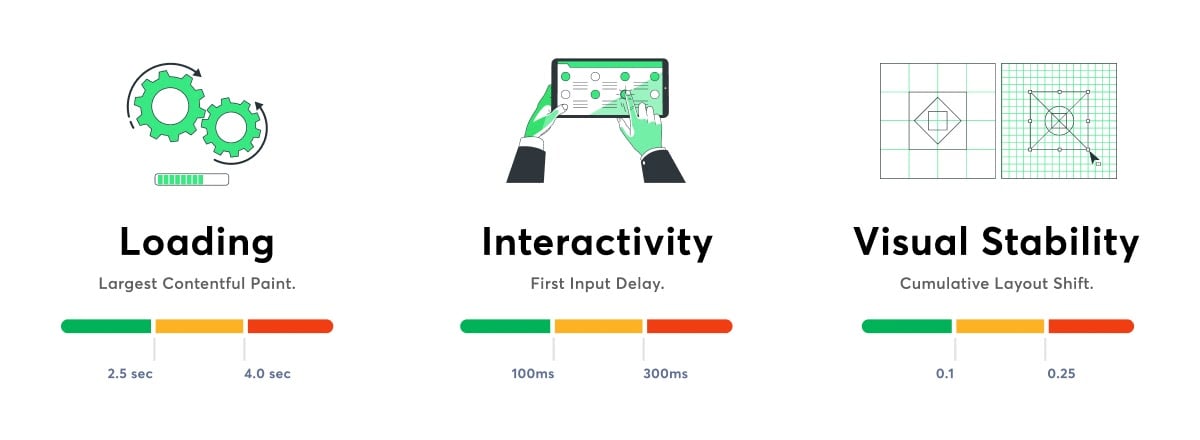
LCP: Largest Contentful Paint
This is the most clear of the metrics; it tests how easily you can draw the largest object on the website, which is most likely the piece of material the consumer is interested in. This could be a banner graphic, text, or something else. It’s obvious that it’s the most significant piece because it’s the largest contentful thing on the page. We used to quantify the similarly called First Contentful Paint (FCP), but LCP has been seen as a good indicator for when the content that the visitor is most likely looking for is created.

Except from the point of the user, LCP is meant to measure loading efficiency and is a good analogue for all of the old output metrics (e.g., Time to First Byte (TTFB), DOM Content Loaded, Start Render, Speed Index). It’s a more straightforward, single metric that helps to provide a reliable measure of website load time. It is a clearer, single metric that aims to give a clear indicator of page load.It is a simpler, single metric that seeks to provide a clear indicator of page load. It does not provide any of the detail covered by other metrics, but it is a simpler, single metric that aims to provide a clear indication of page load.
FID: First Input Delay
The time between which a user interacts with a website, such as clicking on a connection or a button, and when the browser processes the click is measured by this second metric. Its aim is to determine how interactive a page is. It’s a disappointing situation for the user if all of the content is loaded but the website is unresponsive.

This metric cannot be simulated since it is dependent on whether a user clicks or otherwise communicates with a website and how long it takes for the interaction to be completed. When using a research tool without any direct human input, Total Blocking Time (TBT) is a decent proxy for FID, but keep a close eye on Time to Interactive (TTI) when looking at FID.
TTI is a non-standardized web output ‘performance’ measurement that refers to the time when the last Long Task completed and 5 seconds of network and main thread inactivity proceeded.
TTI is a metric proposed by the Web Incubator Community Group in 2018 to define whether a website or programme has valuable content and the main thread is inactive and free to react to user interactions, like getting event handlers documented.
CLS: Cumulative Layout Shift
For a variety of factors, this metric is very unlike any other that has come before it. Its purpose is to determine the page’s graphic consistency, or how much it bounces around as new material is added. I’m sure you know the text bounced around as photos, commercials, and other content loads.

To evaluate the movement of elements, the Cumulative Layout Shift compares frames. It measures the magnitude of layout changes by combining all of the points where they occur. Anything below 0.1 is considered fine by Google, but anything between 0.1 and 0.25 needs improvement. Anything over 0.25 is considered bad.
Developers don’t always state an image’s width and height in the code, instead relying on the browser to determine how the image can look on the page. When viewing a page that contains both images and text, the text will appear first, preceded by the images.
How Does It All Look?
A page experience tag is created by combining all of these metrics. According to Google, page experience is not a ranking score. Even each metric has its ranking and weight in the Google ranking algorithm.
What Are All Of These Factors?
We attributed to the majority of the above, but here’s how Google categorizes each component inside page experience:
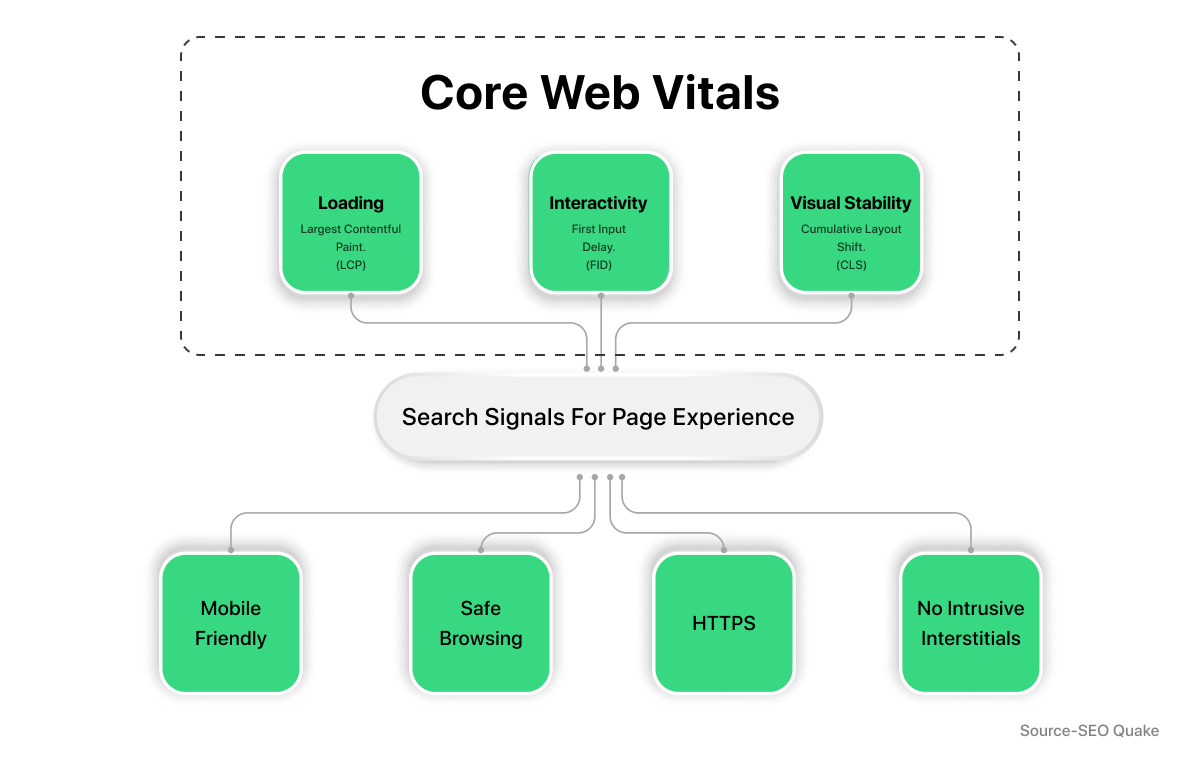
- Largest Contentful Paint (LCP): This metric assesses loading speed. Sites can aim for LCP to occur within the first 2.5 seconds of the page loading to provide a decent user experience.
- First Input Delay (FID): Sites can aim for an FID of less than 100 milliseconds to have a good user interface. It measures interactivity.
- Cumulative Layout Shift (CLS): This is the latest metric that looks at how to secure the website is as it loads (i.e., images, buttons, content move around the page as the page loads, or does the page stay solid or put).
- Responsive to mobile devices: For all mobile devices, the website should be responsive. Always go with responsive website development.
- Safe surfing: The page is free of harmful (such as malware) or misleading (such as social engineering) content. Through the Security Issues report, you can see if your site has any safe-browsing problems.
- HTTPS: It is a secure protocol. HTTPS is used to serve the website. Check to see if the link to your site is safe.
- Non intrusive interstitials: The user can conveniently navigate the information on the website.
Checking Tools for Web Vitals
There are various tools online to assist you in keeping track of Web Vitals and improving the performance of your page.There’s a list of them there. We’d like to call attention to a couple of the most important ones:
- PageSpeed Insights: With both field and test results, PageSpeed Insights has evolved into a full-service measurement platform. Furthermore, you will get guidance on how to change the situation.
- Lighthouse: Lighthouse was created by Google to audit PWAs, but it’s now a fantastic tool for monitoring results. It includes multiple audits that PageSpeed Insights does not, as well as SEO checks.
- GMetrix: GTmetrix, when used in combination with analytics, will help you improve website success by sending you notifications if your page underperforms, as well as historical trending to ensure that your optimization efforts are not wasted.
- Core Web Vitals report from Google Search Console: You will now get information about your site directly from Google Search Console! It’s great to get a sense of how the platform is doing.
- Chrome has a Core Web Vitals report: A Core Web Vitals overlay (starting with Chrome 90 and Chrome 88), with more on the way.
Should We Care About Core Web Vitals?
The solution is clear. It’s the best choice to optimize the site for Core Web Vitals. A quick way to boost the site’s search results in an easy way and with minimal effort. Here are a few steps you should take right away.
- Examine the website for bugs and look for ways to improve them.
You must maintain your website if you wish to fulfill your customers’ needs and have a smooth user experience. It shows you can evaluate it on a routine basis and check for ways to improve it. Content should prevail.
- Make the website responsive.
Websites that aren’t mobile-friendly would appear lower in the SERPs. The most critical thing is to use responsive web development best practices to ensure that your site works smoothly on all devices.The most critical thing is to use responsive website development best practices to ensure that your site works smoothly on all devices. - Optimize all photos and videos.
Images should be of high-resolution and compressed. Often have alt tags in your photos for SEO purposes. Avoid Meta titles of more than 70 characters in length and Meta descriptions of more than 150 characters.
Generate Chrome ux report in google data studio
If you’re paying attention now, you’ll know what We are talking about. You’re probably aware that Core Web Vitals will become a ranking consideration in Google search beginning in May 2021. Building a dashboard is a great way to keep track of your SEO success.
Fortunately, you are in luck . Web.dev have already created a Google Data Studio link for their API, as well as a dashboard to accompany it.
To start generating the report:
- You’ll open the template in a separate tab by clicking here.
- When the report is open in Data Studio, click on the 2 sheets of paper in the upper right corner to copy it.
- You can see a light-box that allows you to use a new data source. Click “New Data Source” and then “Create New Data Source” at the bottom.
- In the search window, type “Chrome UX Report.”
- Enter any URL you’d like to watch through the Chrome UX Report connector.
- In the next page, click “OK” in the top right, then “Add To Report” in the top right.
- Finally, on the last page, press “Copy Report.”
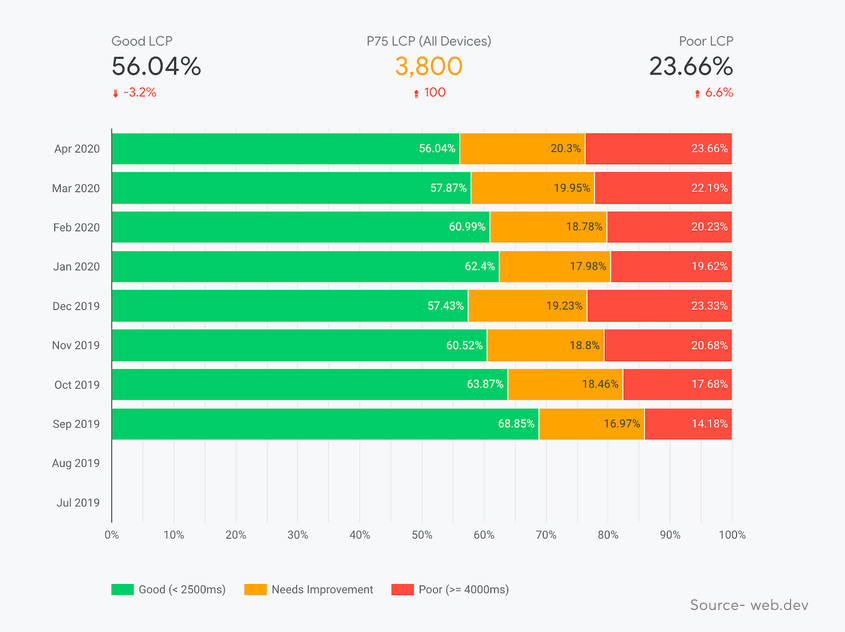
Your brand new report should appear in a new tab! Before we get into the study, there’s a huge disclaimer. If your website doesn’t get a lot of traffic, this report, like Google Search Console Web Vitals, will be missing information. The Chrome UX Report is a shared data collection that contains real-world user interface information.
Google Search Console Screenshot
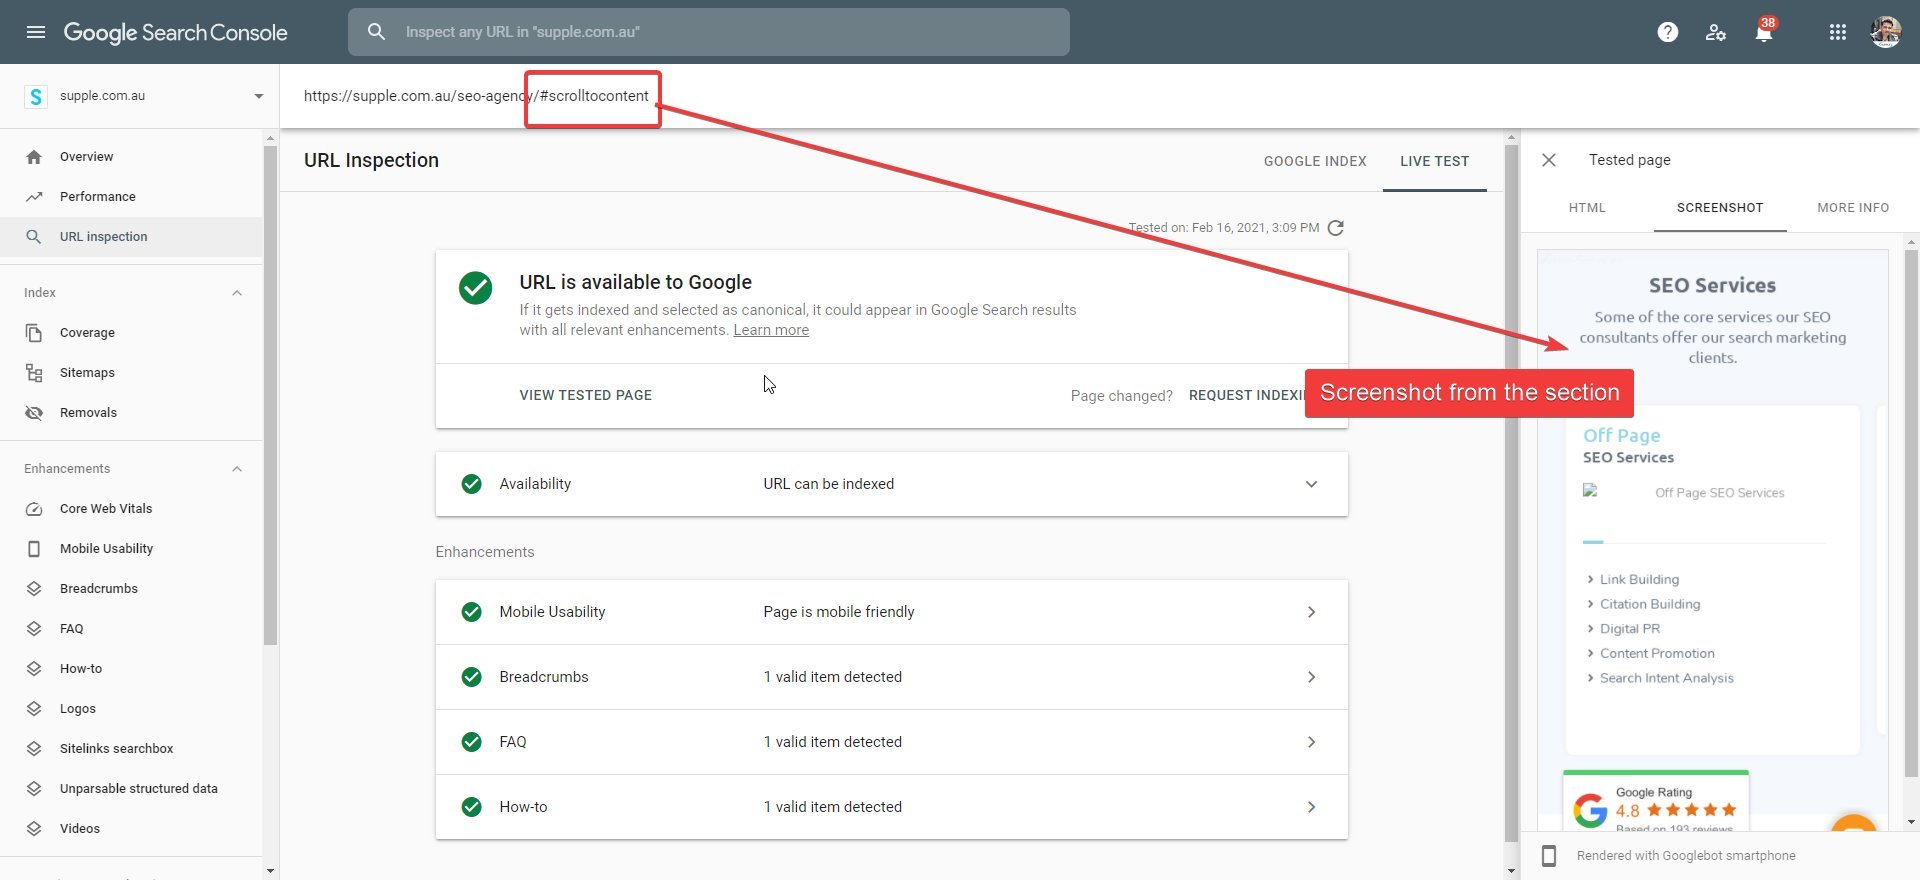
Many people have created a way to get Google Search Console to present a screenshot of the centre or section of the page. The URL inspection tool normally only takes screenshots of the top of the page, if you’re using the scroll-to-text URL, Google can take screenshots all the way down. To connect using #anchors, all you need is a quick old-fashioned leap. #screenshot was used to incorporate this tale.
If you add the connection to the jump link anchor text, Google Search Console will scroll down to that section, skip the stuff above it, and show a screenshot from there.
Need Help?
If you need help dealing with this new Google update, We will help you with solutions that will enhance your user experience and boost your digital presence!
